
How Kumberi Works
Model the decisions between today and retirement — not just retirement itself
Deterministic calculations based on current UK tax codes. Every result can be traced, inspected and explained.



From Inputs To Clear Projections
Once your journey is modelled, you get readable wealth charts, tax breakdowns and retirement views — not a black box.
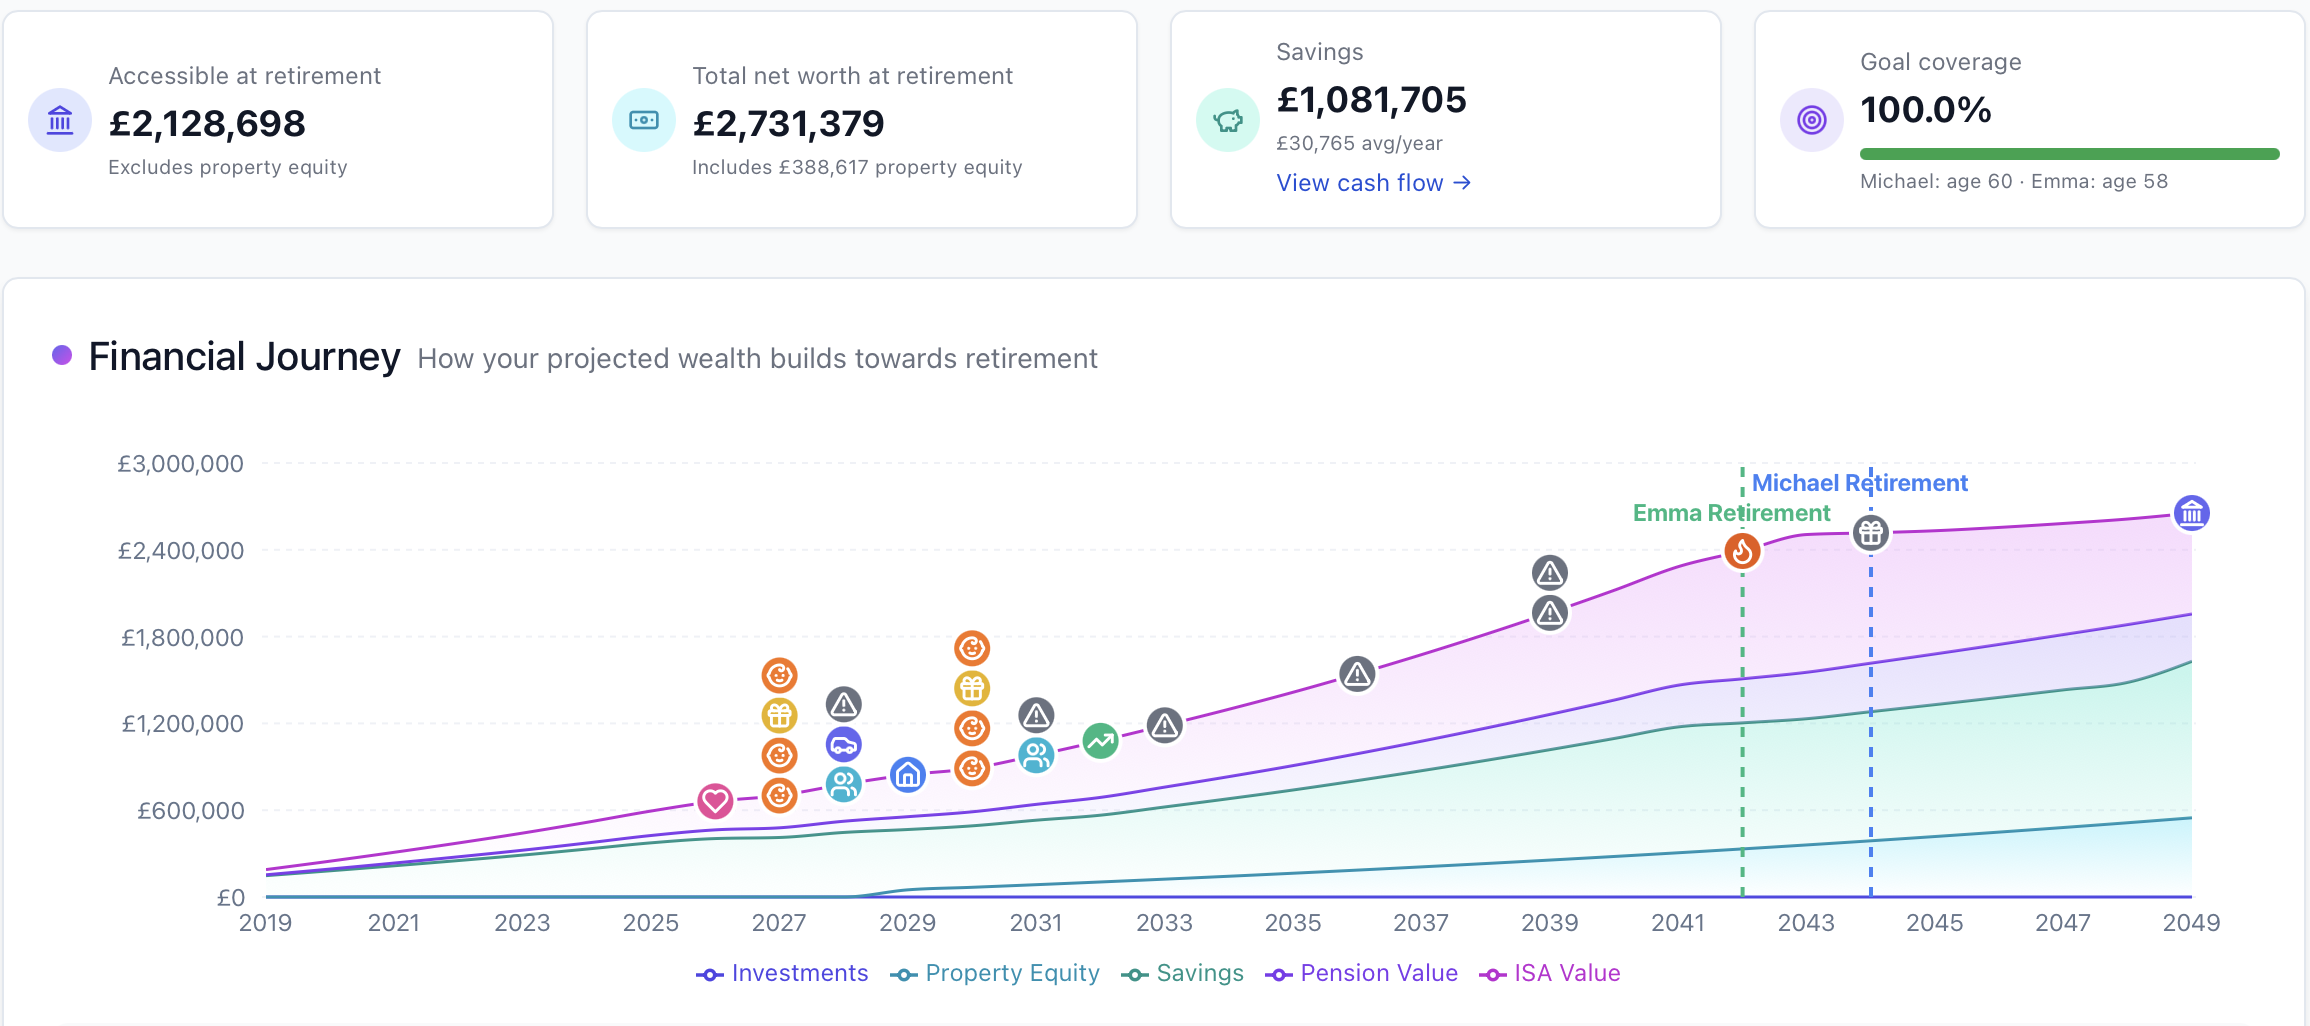
Clear Results
Interactive charts and organised summaries, with results categorised and time-indexed.
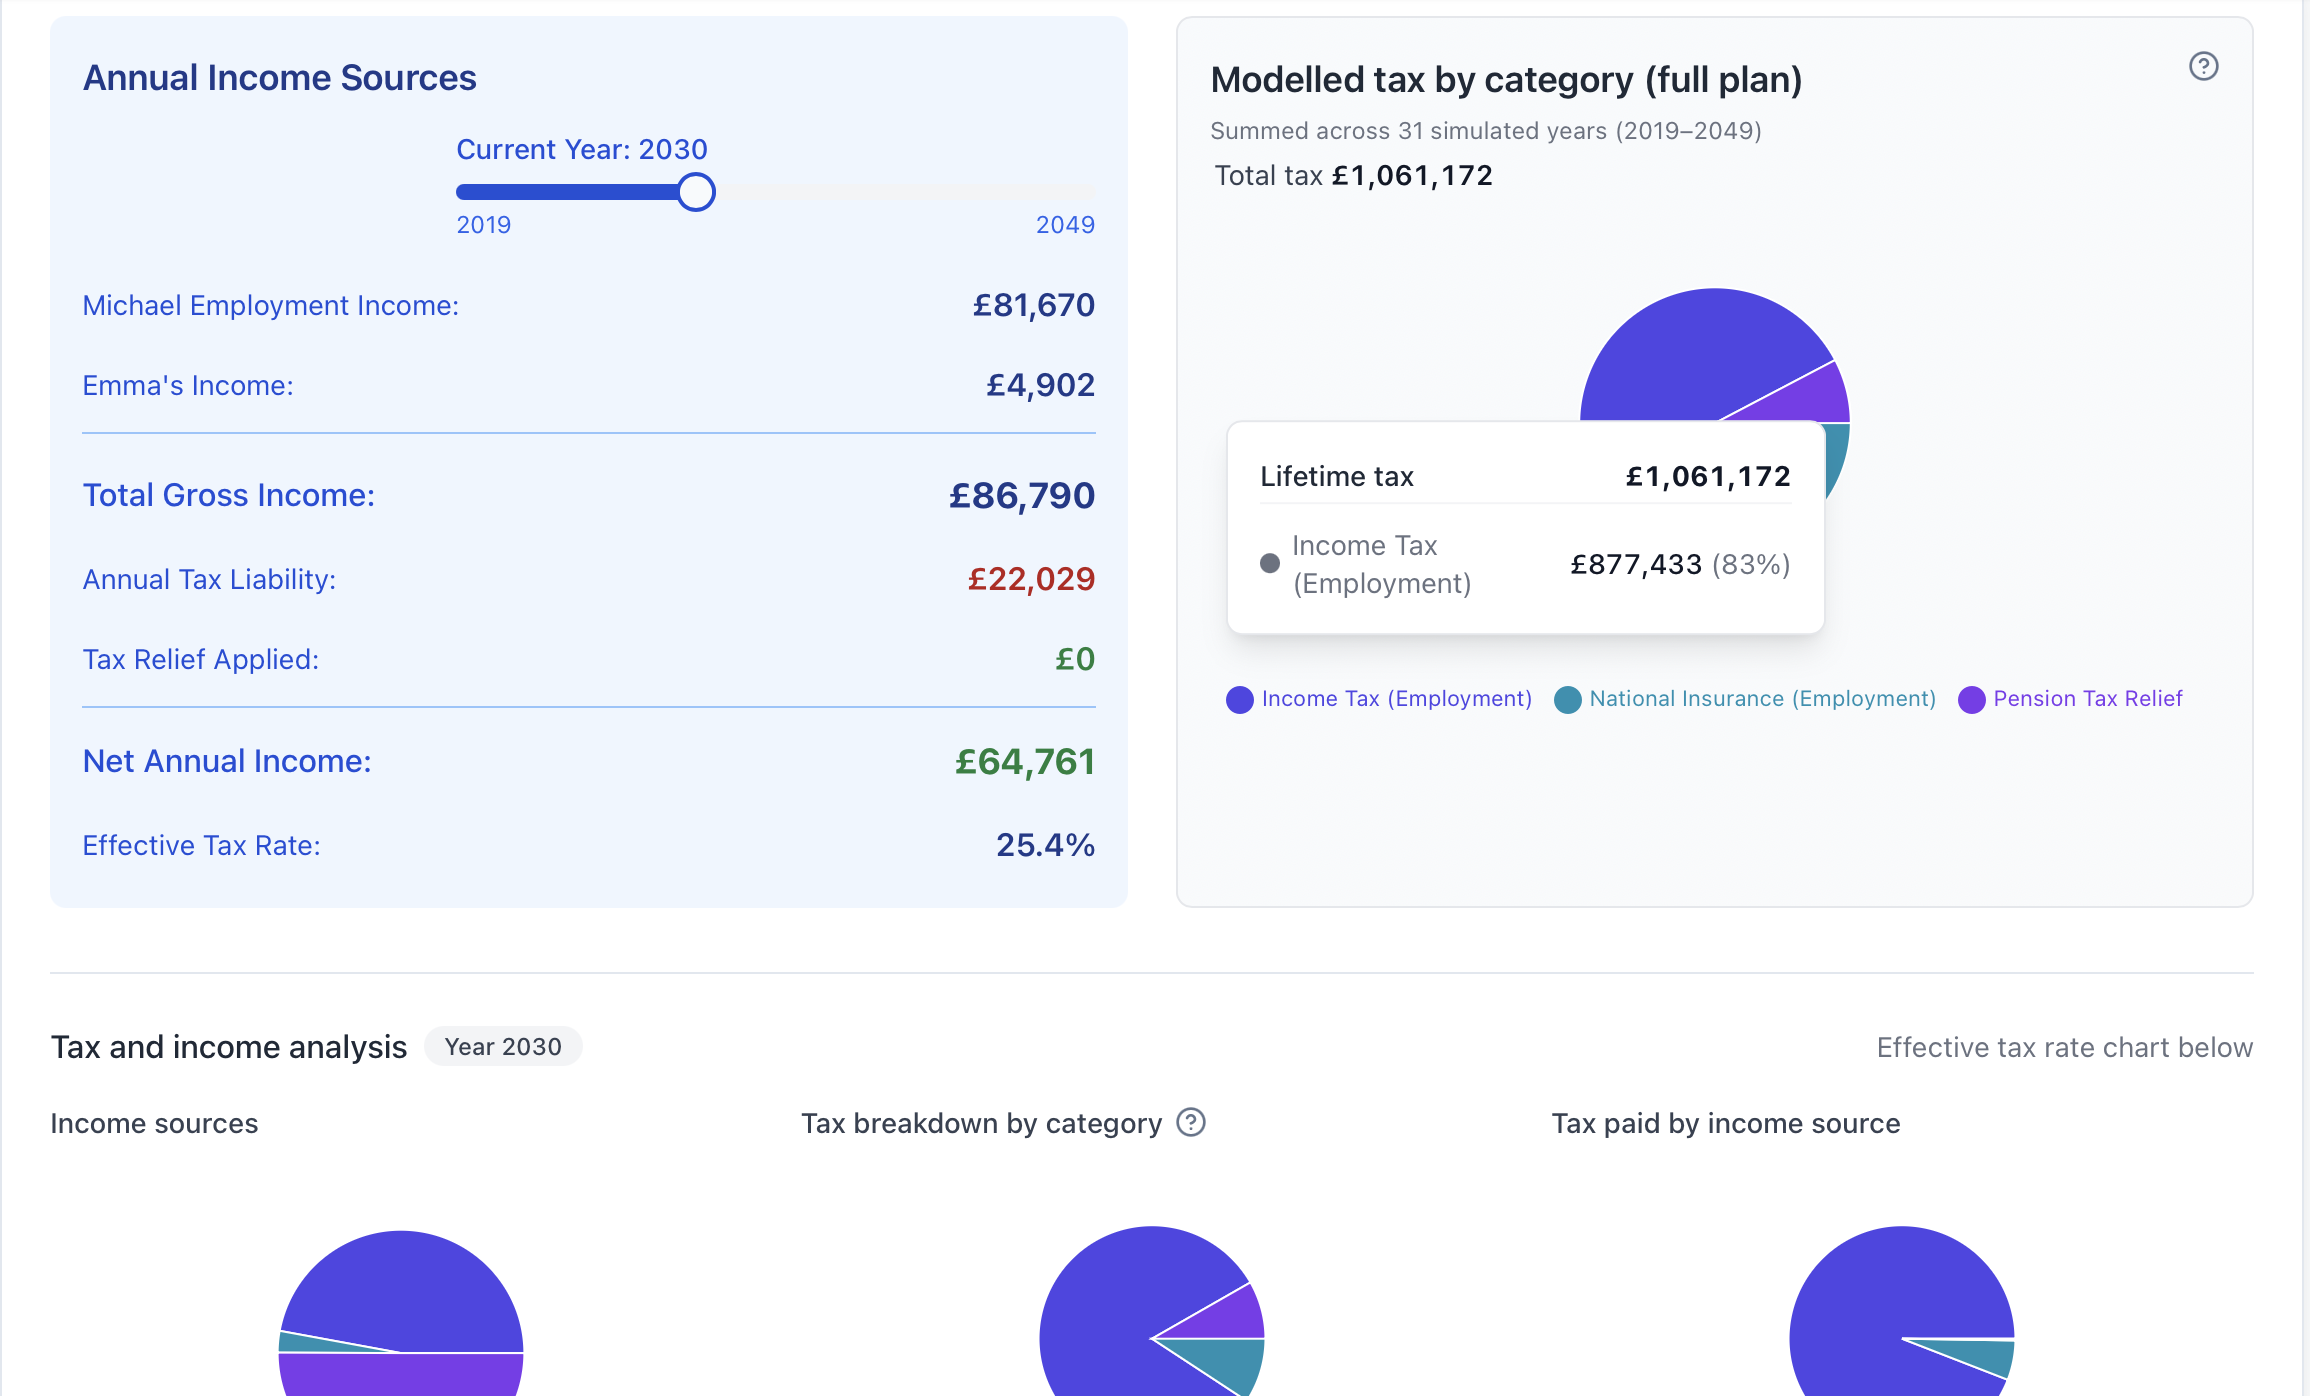
UK Tax Compliance
Built around UK tax year boundaries, current rates and allowances reflected in the model outputs.
How It Works
Name the decision, add what follows on the same timeline, then open the working — UK tax, cash flow and the assumptions behind the chart.

Enter Your Numbers
Salary, savings, property, pensions — whatever the decision needs. We only ask for what the calculation uses.
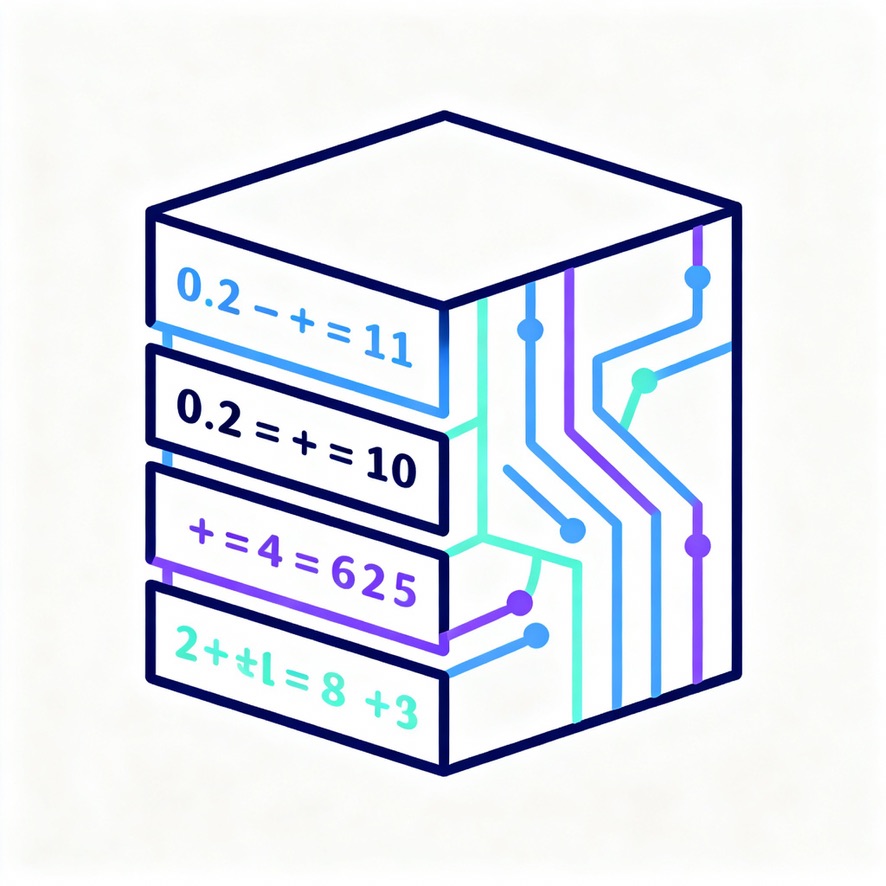
The Model Runs
Compounding, tax and pension rules apply the same way every time — same inputs, same result, no black box. Later events on the same journey run through that loop, so a pay change changes what the house still costs.

See It Year By Year
Charts and summaries organised by year, so you can see when things change — not just where the line ends up.
Current UK Tax Rules
Tax year boundaries, rates and allowances checked against HMRC guidance — not last year's figures.

Nothing You Did Not Ask For
Journeys are stored encrypted, accessible from any device. No bank connection, no data the model does not need.

Try More Than One Path
Model a different life path and see what it does to cash flow, tax and retirement — then compare it to the first.
Data Flow Process




Accurate UK Tax Calculations
We use official HMRC tax rates and allowances, updated after budget announcements. Calculations reflect the latest published figures for income tax, National Insurance, pensions and ISA allowances.
House-Price Growth In The Model
A location lookup fills a recent local snapshot (ONS median price paid by neighbourhood, or UKHPI for a region). The model does not keep that snapshot forever.
- Year 0: the snapshot you see in the form, which you can overwrite.
- Over 7 years: a straight line from that snapshot to 3% a year, whether the snapshot is negative or a high positive. Year 7 is 3%.
- After year 7: 3% a year. That background is a modelling assumption, not a forecast.
Example: London UKHPI at −3.7% moves toward +3% over seven years. A 5.8% North West snapshot moves down toward the same 3%. This is how the projection is built, not a view on where prices will go.
Built For Reliability
You should be able to trace every figure — same inputs, same result, assumptions you can open.
Mathematical Precision
- •Same inputs, same result, every run
- •Built on published UK tax and pension rules
- •Checked against HMRC guidance
- •Monte Carlo paths are the only randomness — and you choose when to run them
Transparent Process
- •Every assumption stated next to the number it affects
- •A full methodology page, not a black box
- •Based on the current UK tax code, not last year's
- •Open the working any time — nothing hidden behind the verdict
Every projection can be opened, checked and understood. That is the point of the working sitting next to the chart.
Ready When You Are
Two free what-ifs. No credit card. Go Premium when one choice really matters.